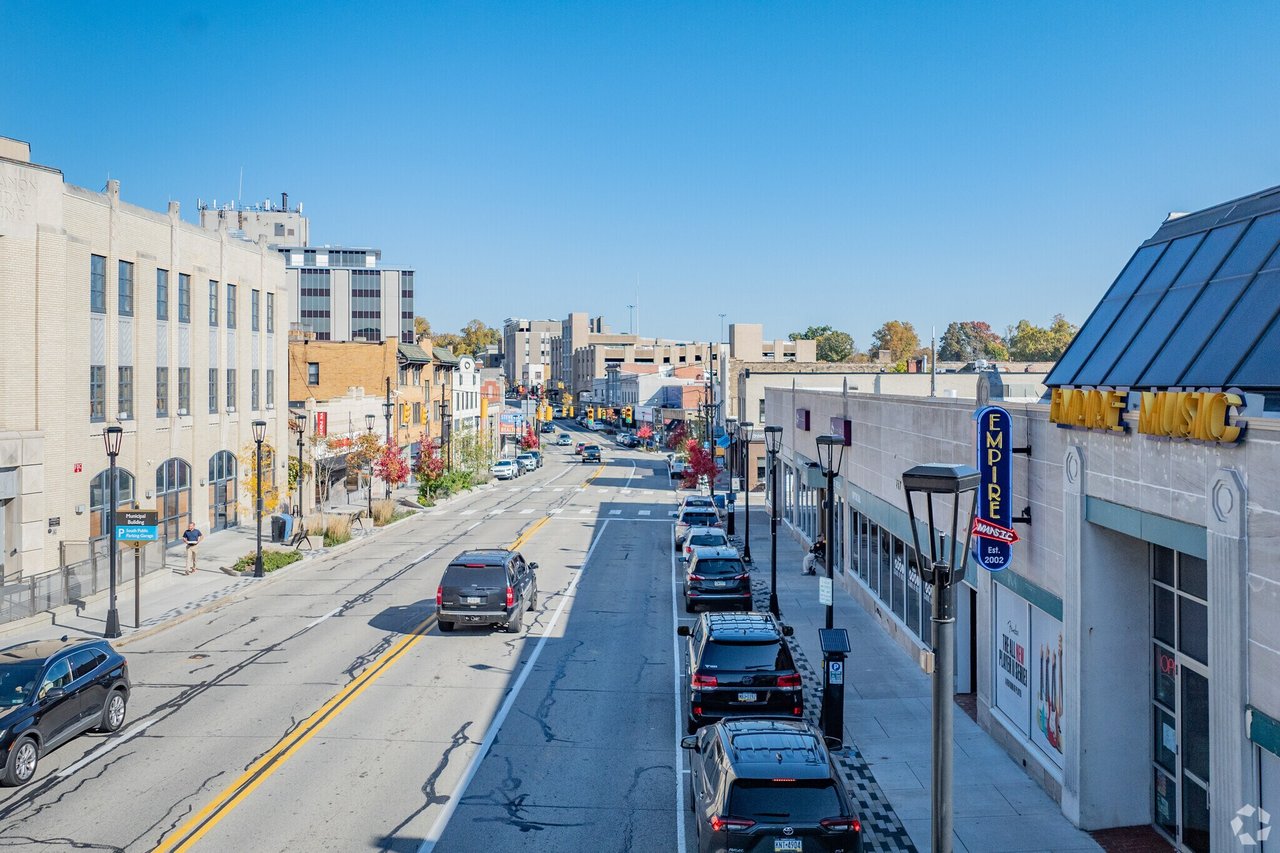
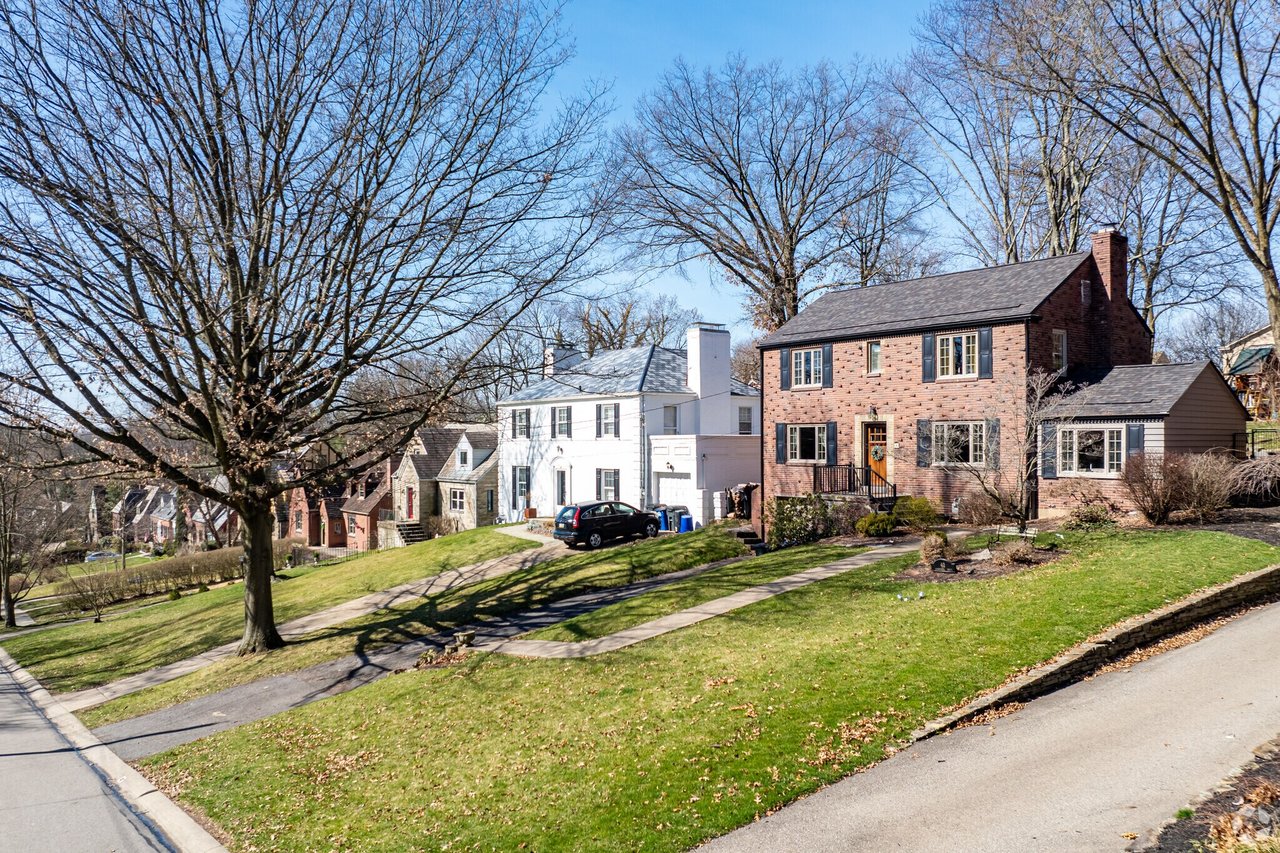
As with many communities in the South Hills of Pittsburgh, Mt. Lebanon’s residential development coincides with the rise of the streetcar. The Pittsburgh & Birmingham Traction Company began operating streetcars from Mt. Lebanon to the Steel City in July of 1901, transforming the once rural community into a burgeoning suburb where residents could live amongst nature and commute into Pittsburgh’s industrial center.
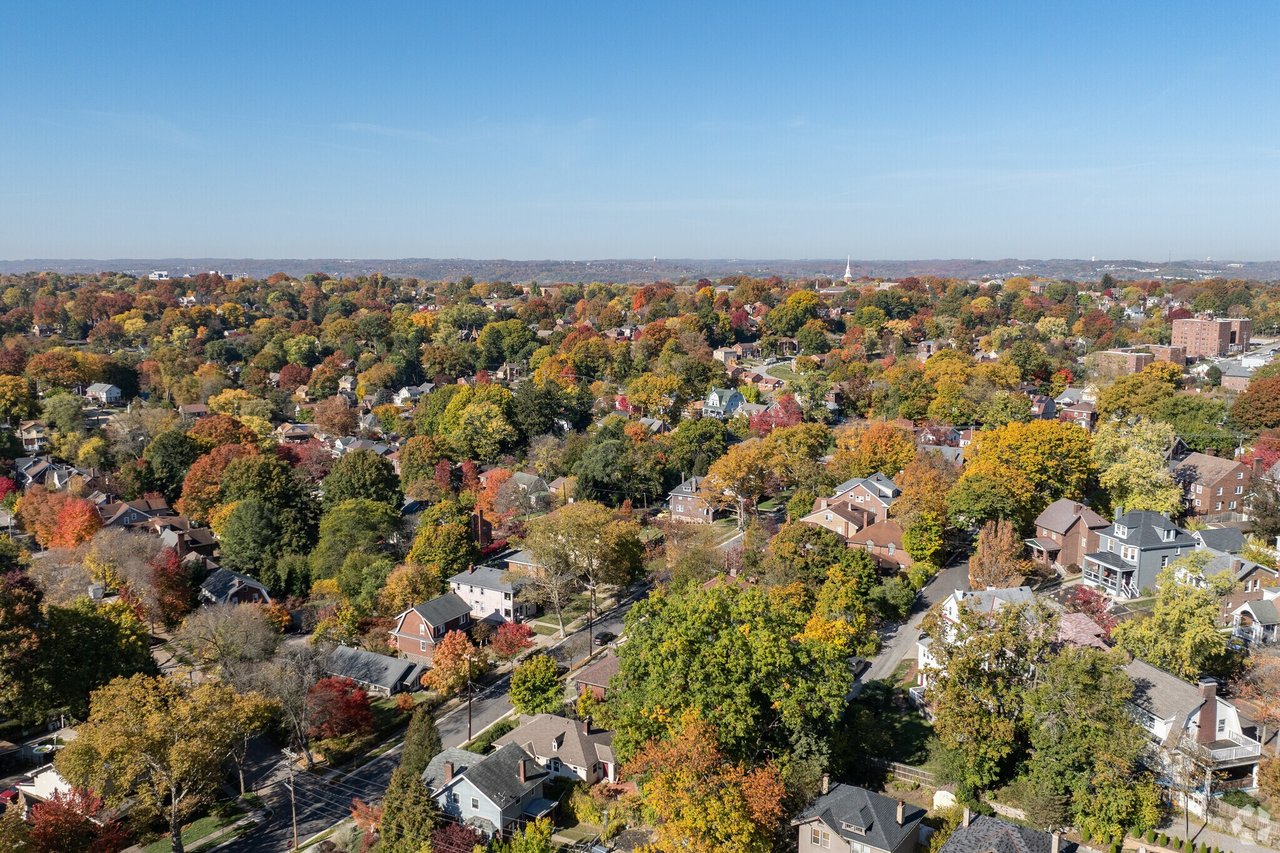
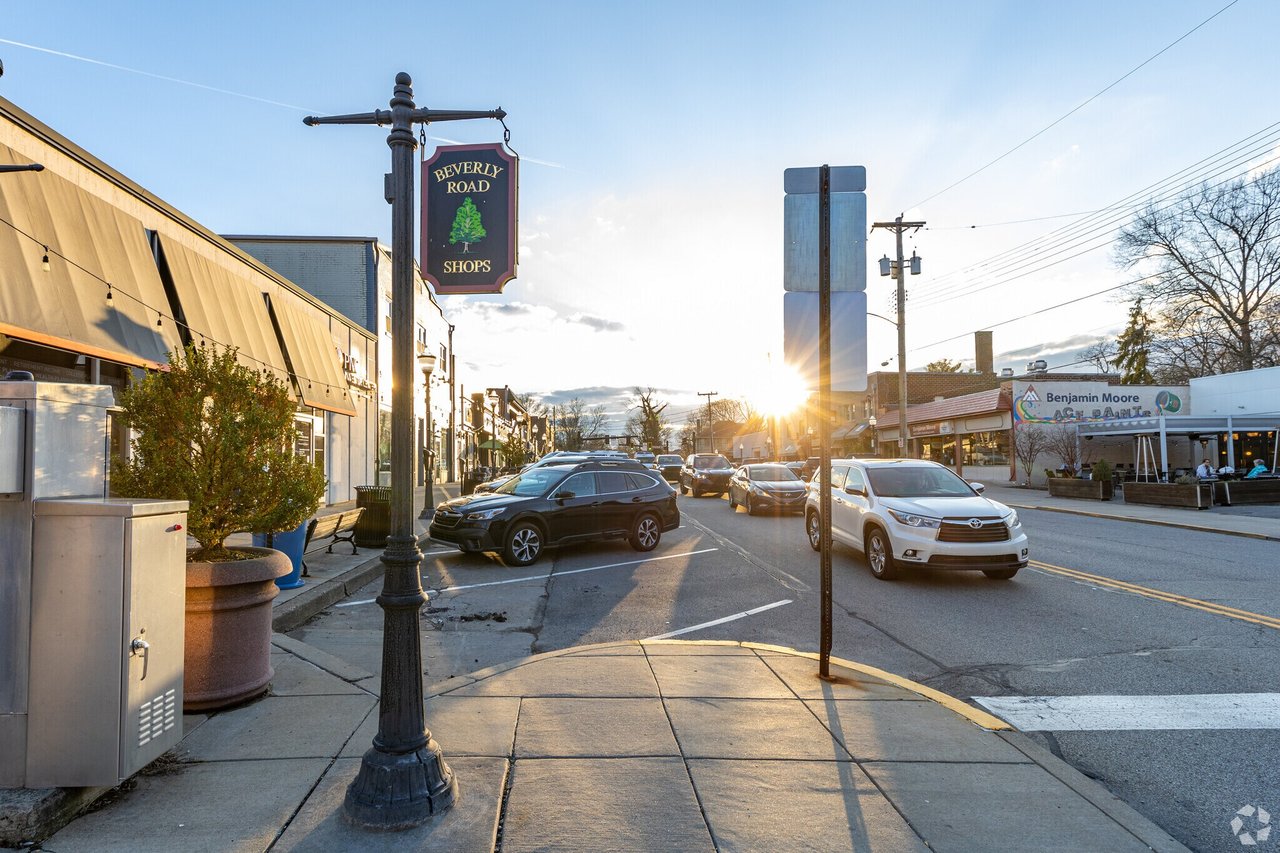
Today, Mt. Lebanon is home to about 33,000 people. The community spans just over 6 square miles and it continues to see new residential and commercial development. Mt. Lebanon also boasts an extensive network of sidewalks that connect its residential subdivisions, highly rated schools, 16 community parks and three main commercial corridors. PBS’s “America’s Walking” featured Mt. Lebanon as one of the most walkable small towns in the country, and the municipality's Sidewalk Expansion Policy invites property owners to request financial support for the addition of sidewalks in their own neighborhoods.
33,555 people live in Mt. Lebanon, where the median age is 45 and the average individual income is $73,121. Data provided by the U.S. Census Bureau.
Total Population
Median Age
Population Density Population Density This is the number of people per square mile in a neighborhood.
Average individual Income
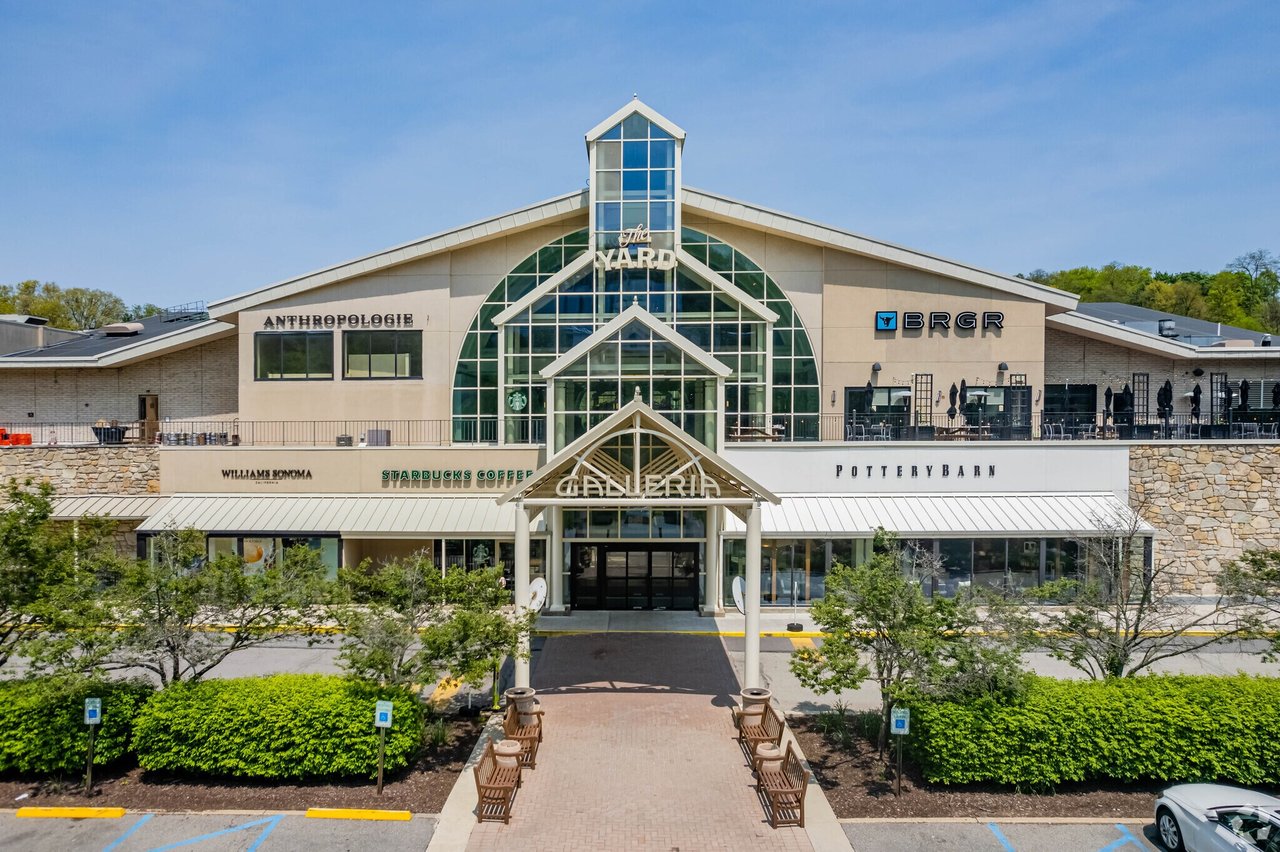
There's plenty to do around Mt. Lebanon, including shopping, dining, nightlife, parks, and more. Data provided by Walk Score and Yelp.
Explore popular things to do in the area, including Flora Park Creamery, Spark Motion Body Studio, and Lush Cosmetics.
| Name | Category | Distance | Reviews |
Ratings by
Yelp
|
|---|---|---|---|---|
| Dining | 4.01 miles | 13 reviews | 5/5 stars | |
| Active | 1.55 miles | 5 reviews | 5/5 stars | |
| Beauty | 2.25 miles | 17 reviews | 5/5 stars | |
| Beauty | 3.47 miles | 10 reviews | 5/5 stars | |
| Beauty | 1.55 miles | 9 reviews | 5/5 stars | |
|
|
||||
|
|
||||
|
|
||||
|
|
||||
|
|
||||
|
|
Mt. Lebanon has 13,666 households, with an average household size of 2. Data provided by the U.S. Census Bureau. Here’s what the people living in Mt. Lebanon do for work — and how long it takes them to get there. Data provided by the U.S. Census Bureau. 33,555 people call Mt. Lebanon home. The population density is 7,005 and the largest age group is Data provided by the U.S. Census Bureau.
Total Population
Population Density Population Density This is the number of people per square mile in a neighborhood.
Median Age
Men vs Women
Population by Age Group
0-9 Years
10-17 Years
18-24 Years
25-64 Years
65-74 Years
75+ Years
Education Level
Total Households
Average Household Size
Average individual Income
Households with Children
With Children:
Without Children:
Marital Status
Blue vs White Collar Workers
Blue Collar:
White Collar: